Residential Energy
Management Tools
PG&E and Bellawatt have already teamed up to help millions of customers navigate electrification choices through tools like the Energy Action Guide. This interactive RFP experience outlines our proposed solution architecture and UX approach to REMT.
We’ve prepared this to make it easy for your team.
This interactive overview is designed to streamline your review process. Each section maps to a key area of your RFP, with working examples that demonstrate how the platform serves your customers.

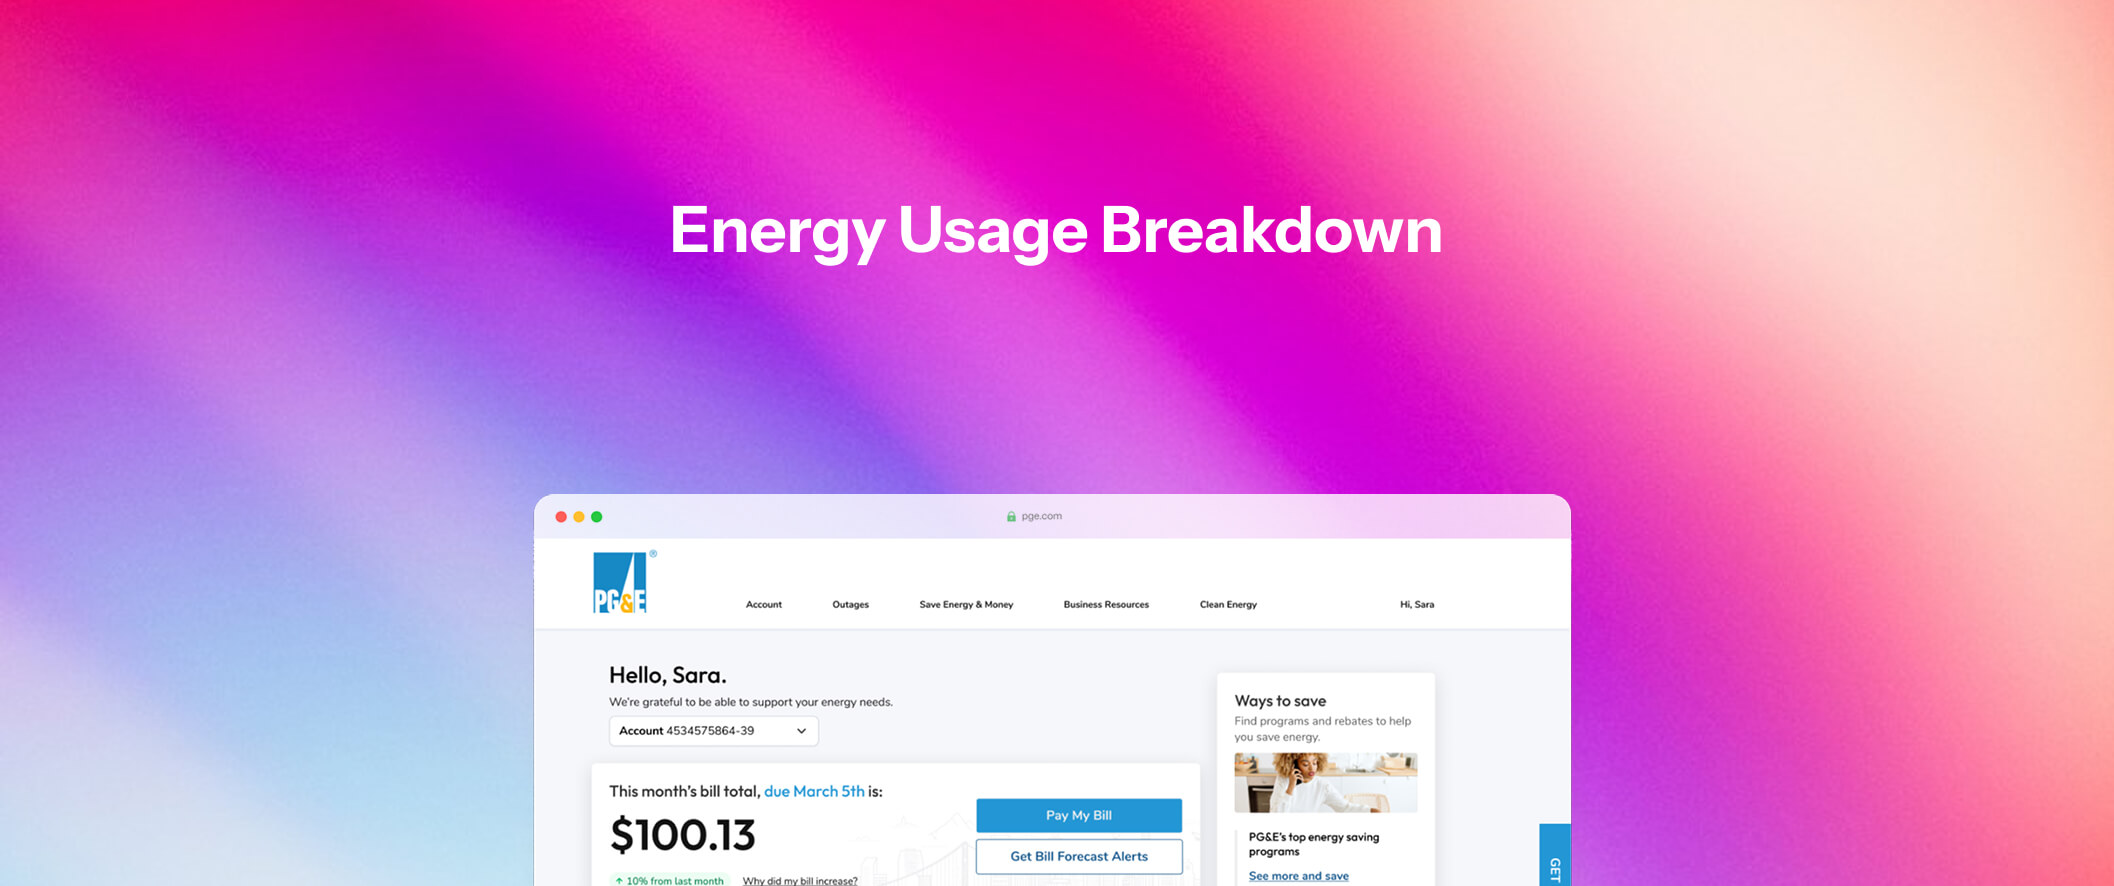
Energy Usage Breakdown
Helping customers gain deep insights into their energy consumption patterns.
Requirements covered:
Requirement 1.1
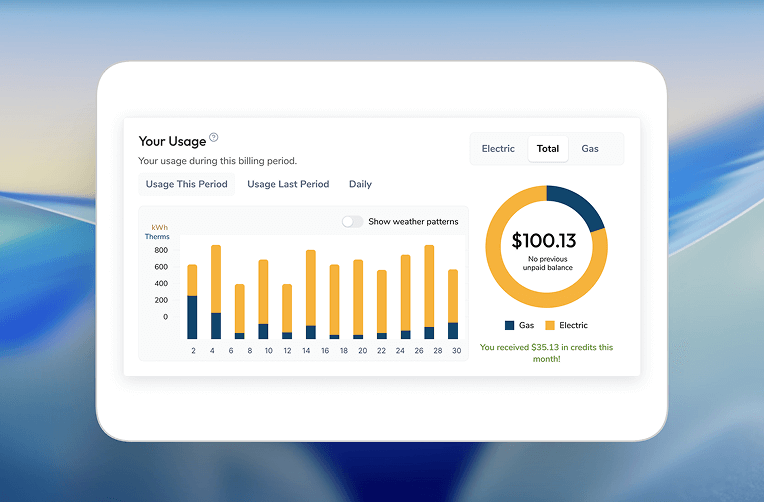
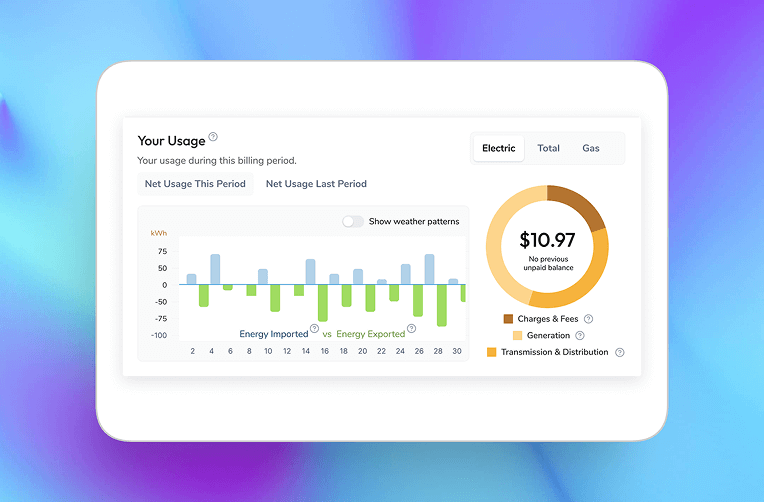
Platform enables all residential customer types to visually view their energy usage over user-specified time periods. It supports all residential rate types and combinations, including riders, adders, and programs—for example, viewing usage from an E1 rate to a Solar Billing Plan with paired storage.
Requirement 1.2
Platform allows user to toggle between Combined, Electricity or Natural Gas and the graph will update the display to show use over the course of the selected timeframe view for the selected commodity. Applies to customers with distributed energy resources (DERs). See section below on Solar Capabilities / Attributes for more requirements.
Requirement 1.3
Platform has selectable usages: electricity, (kWh), natural gas(therm) and combined (kWh and therms = units).
Requirement 1.4
Platform has selectable timeframes views: day(hourly)[Electric only], bill(daily), year(monthly). Platform will show a legend.
Requirement 1.5
Platform provides customers with multiple meters on same account ability to toggle between SA's to view usage/cost.
Requirement 1.6
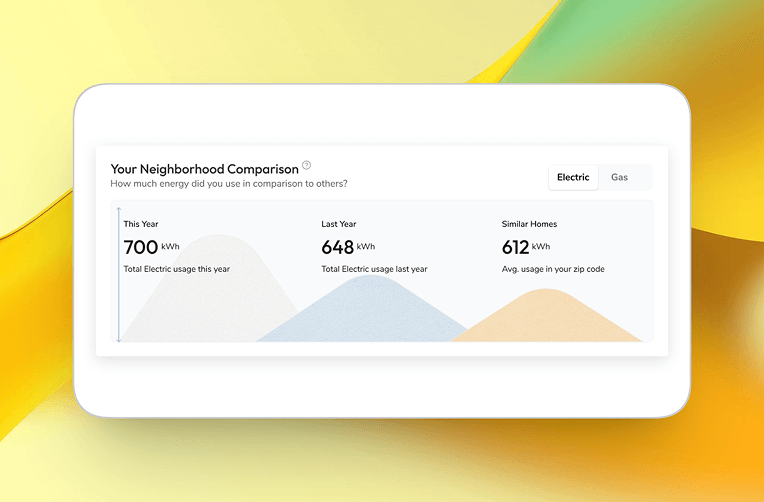
Platform allows customers to compare/benchmark their energy use with homes that are similar (~#occupants, sq.ft,pool,yr built,etc) to their own. This comparison is available only at Year View for Electricity or Natural Gas, but not combined commodities. Platform provides icons that can expand to help answer immediate customer questions such as what is PG&E using to compare my home? Or what does a similar home mean? The platform must be able to answer basic customer questions that might arise from the customer using the platform. Where/When applicable link to beneficial programs or tools that might be a good next step for customer to explore if they would like to learn more.
Requirement 1.7
Platform will identify and display current customer rate plan, tariff adders (NEM) and programs enrolled on tool landing page.
Requirement 1.8
Platform will present customer energy usage costs as required for energy usage.
Requirement 1.9
Platform will present customer energy usage cost graphics in different colors to show different $/kWh rates, credits, programs. (ex. peak / off peak, SmartRate).
Requirement 1.10
Platform shows independent of (elec or gas) commodity selected, overlay a line graph showing the weather over the selected timeframe, enabling the customer to see how their Energy Use changed with respect to the temperature. The Weather Line represents the average weather for each month and the bar rollover shows the high and low temps for that period.
Requirement 1.11
All temperatures are based on a regional average that’s associated with each customer’s premise, so there can be some variance with the actual temperature at a customer’s home.
Requirement 1.12
Source of weather data must be the same source that PG&E uses for its other digital tools or services. PG&E wants its weather data to be the same across all tools/services.
Requirement 1.13
For a NEM customer, both Energy Use (Consumption) and Energy Sent to the Grid (generation) are shown on the graph. Energy sent to the grid is shown in manner that best helps the customer understand what the data means to them. Show things like when legacy date ends or other NEM info that could be helpful for example True-Up. For Solar Billing Plan (SBP) customers (i.e. Net Bill Tariff or NEM3) both Energy Use (Consumption) and Energy Sent to the Grid (Generation) are shown on the graph. Energy sent to the grid is shown in manner that best helps the customer understand what the data means to them. Help customer understand that the credit rate change hourly. Provide a legend. Help the customer understand that Solar Billing Plan is different from NEM1 and NEM2 for example credits are hourly and by season. Also, there is a 5 year price tiering for early adopters. If supplier has other solutions in mind please present them to PG&E.
Requirement 1.14
Compare to Last Year: By selecting Compare to Last Year, the graph will toggle to display a side-by-side monthly comparison of NEM charges between this year and the same time last year. The graph will also show pre-solar dollar amounts if the customer was non-NEM in the prior year.
Requirement 1.15
NEM Charges: provides a bar graph of the customer’s Monthly NEM Charges, which represents the monthly net cost of electricity. This graph also overlays the Monthly NEM Charges with a line graph of the customer’s Cumulative NEM Charges, which represents a running total of the user’s net electricity costs.
Requirement 1.16
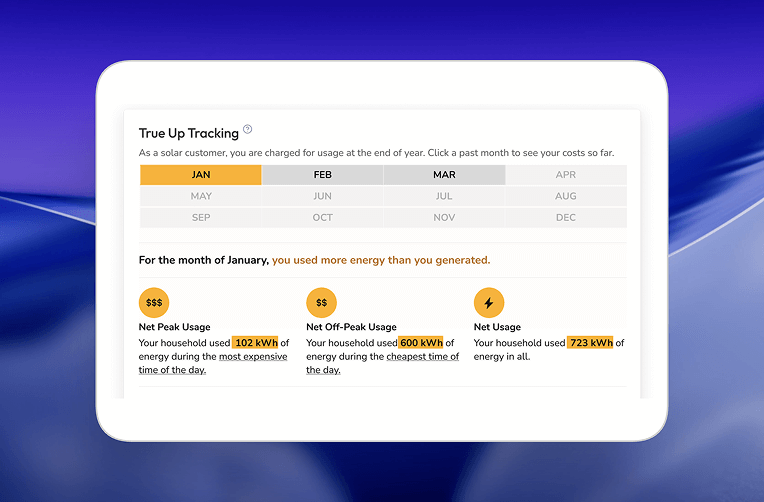
Financials: This section of the feature provides the user with the number of months remaining until they reach their True Up Date as well as their current Cumulative NEM charge. If the current Cumulative NEM charge is negative, this section will explain what happens if the amount is negative at True-Up.
Requirement 1.17
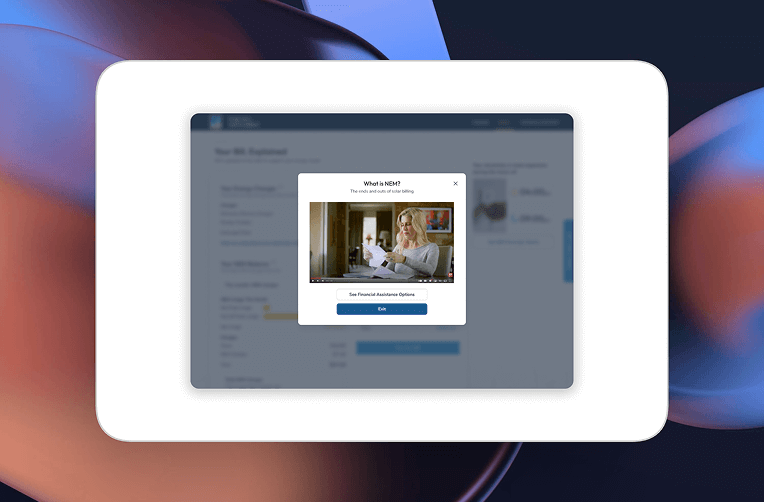
Ability to provide educational pop ups or insights (see requirement around making platform smarter (in Future Use Cases tab) that help NEM customers with the operation of their system. For example 'have you cleaned your panels in the last year' or 'Here is a link to the Clean Energy Calculator if you are interested in battery storage' or 'you're transitioning from NEM1 to Solar Billing Plan because your legacy period is ending'
Requirement 1.18
Platform shows applicable PG&E program credits or other program benefits to customers (ex. smart rate credits, demand credit or other program incentives/credits ). List demand response program bill credits.
Requirement 1.19
By hovering the mouse over a bar, the feature will display Energy Use(by type if available), Cost (by type if available) and High/low, average Weather for that particular period. Clicking on box provides additional info
Covered in documentation:
Requirement 1.20
See Provide access to Green Button Download My Data from this tool. See FEATURE: Green Button Download My Data for more details on the tool.
Requirement 1.21
Platform shall display a pop-up window or notification with- links to other PG&E tools or programs, suggest a better rate, upcoming weather events that may impact usage, provides advice such as shifting usage to save money, or ask for customer feedback on the user experience. Have the ability to store and surface to PG&E employees via searchable database. Must have the ability to add a net new pop up within the same day.
Video Walkthrough

Overview
Walkthrough of the energy usage features.
Snapshots
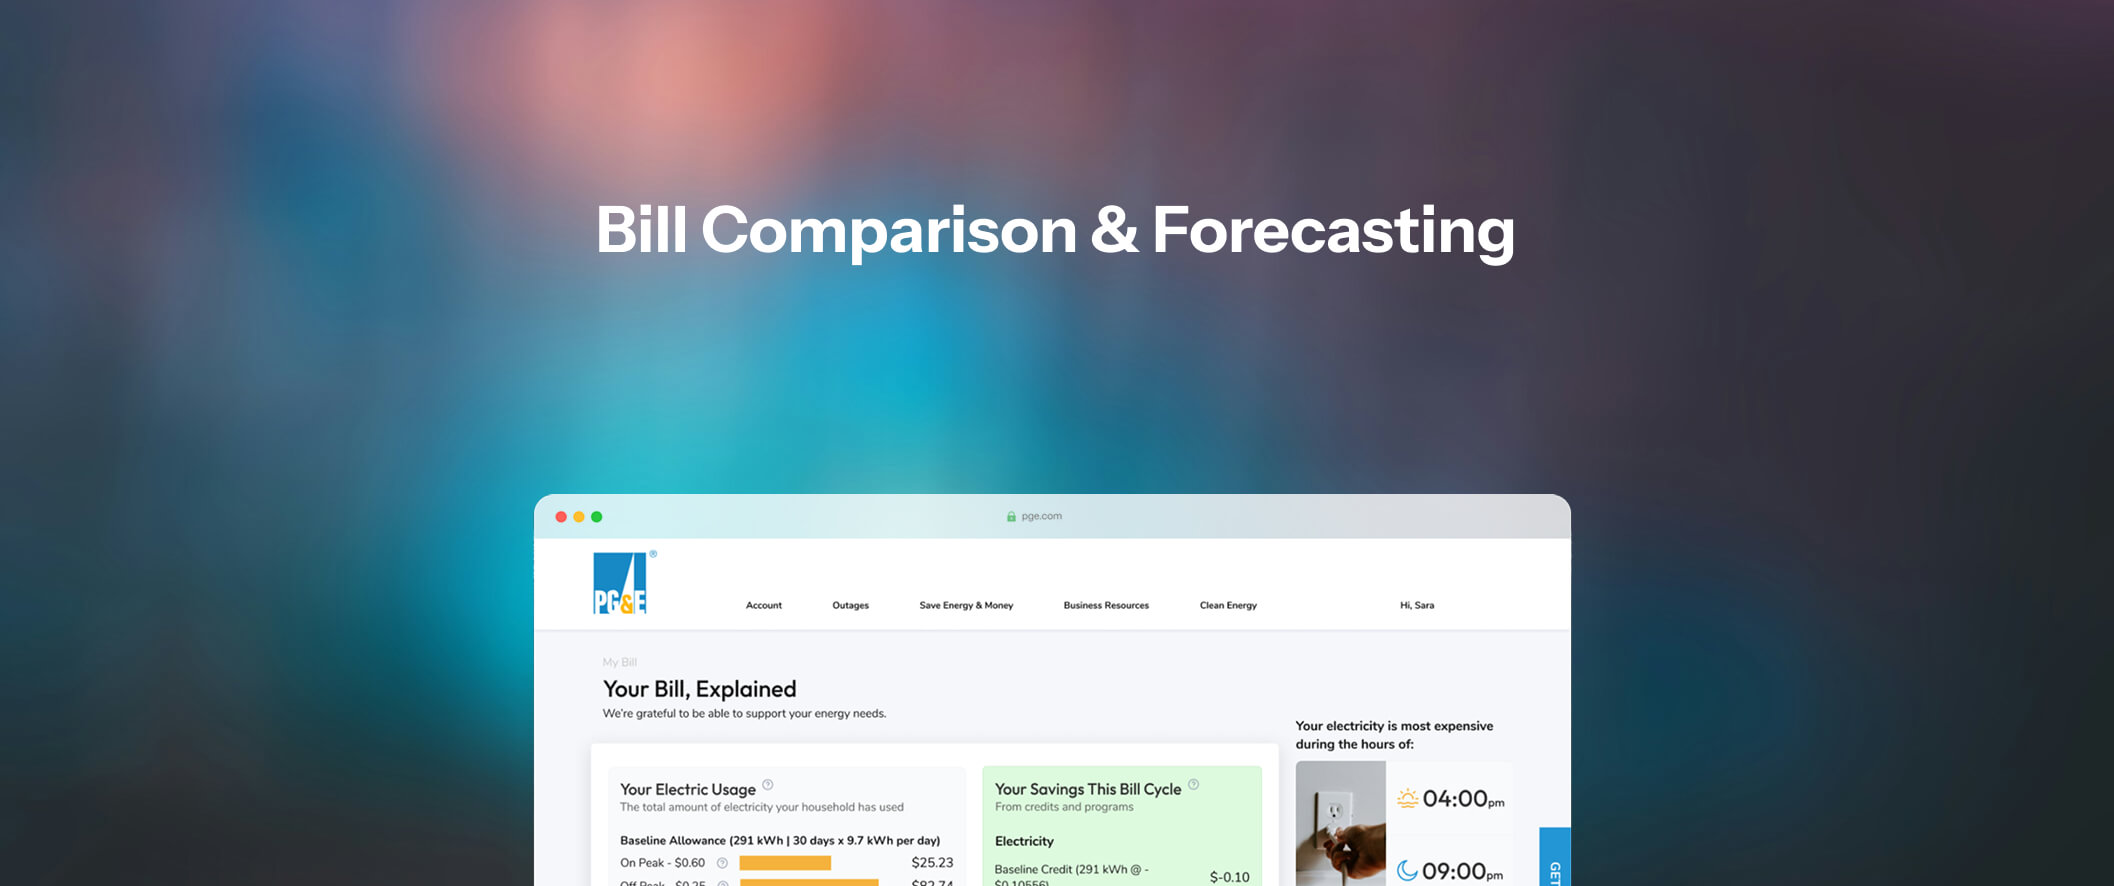
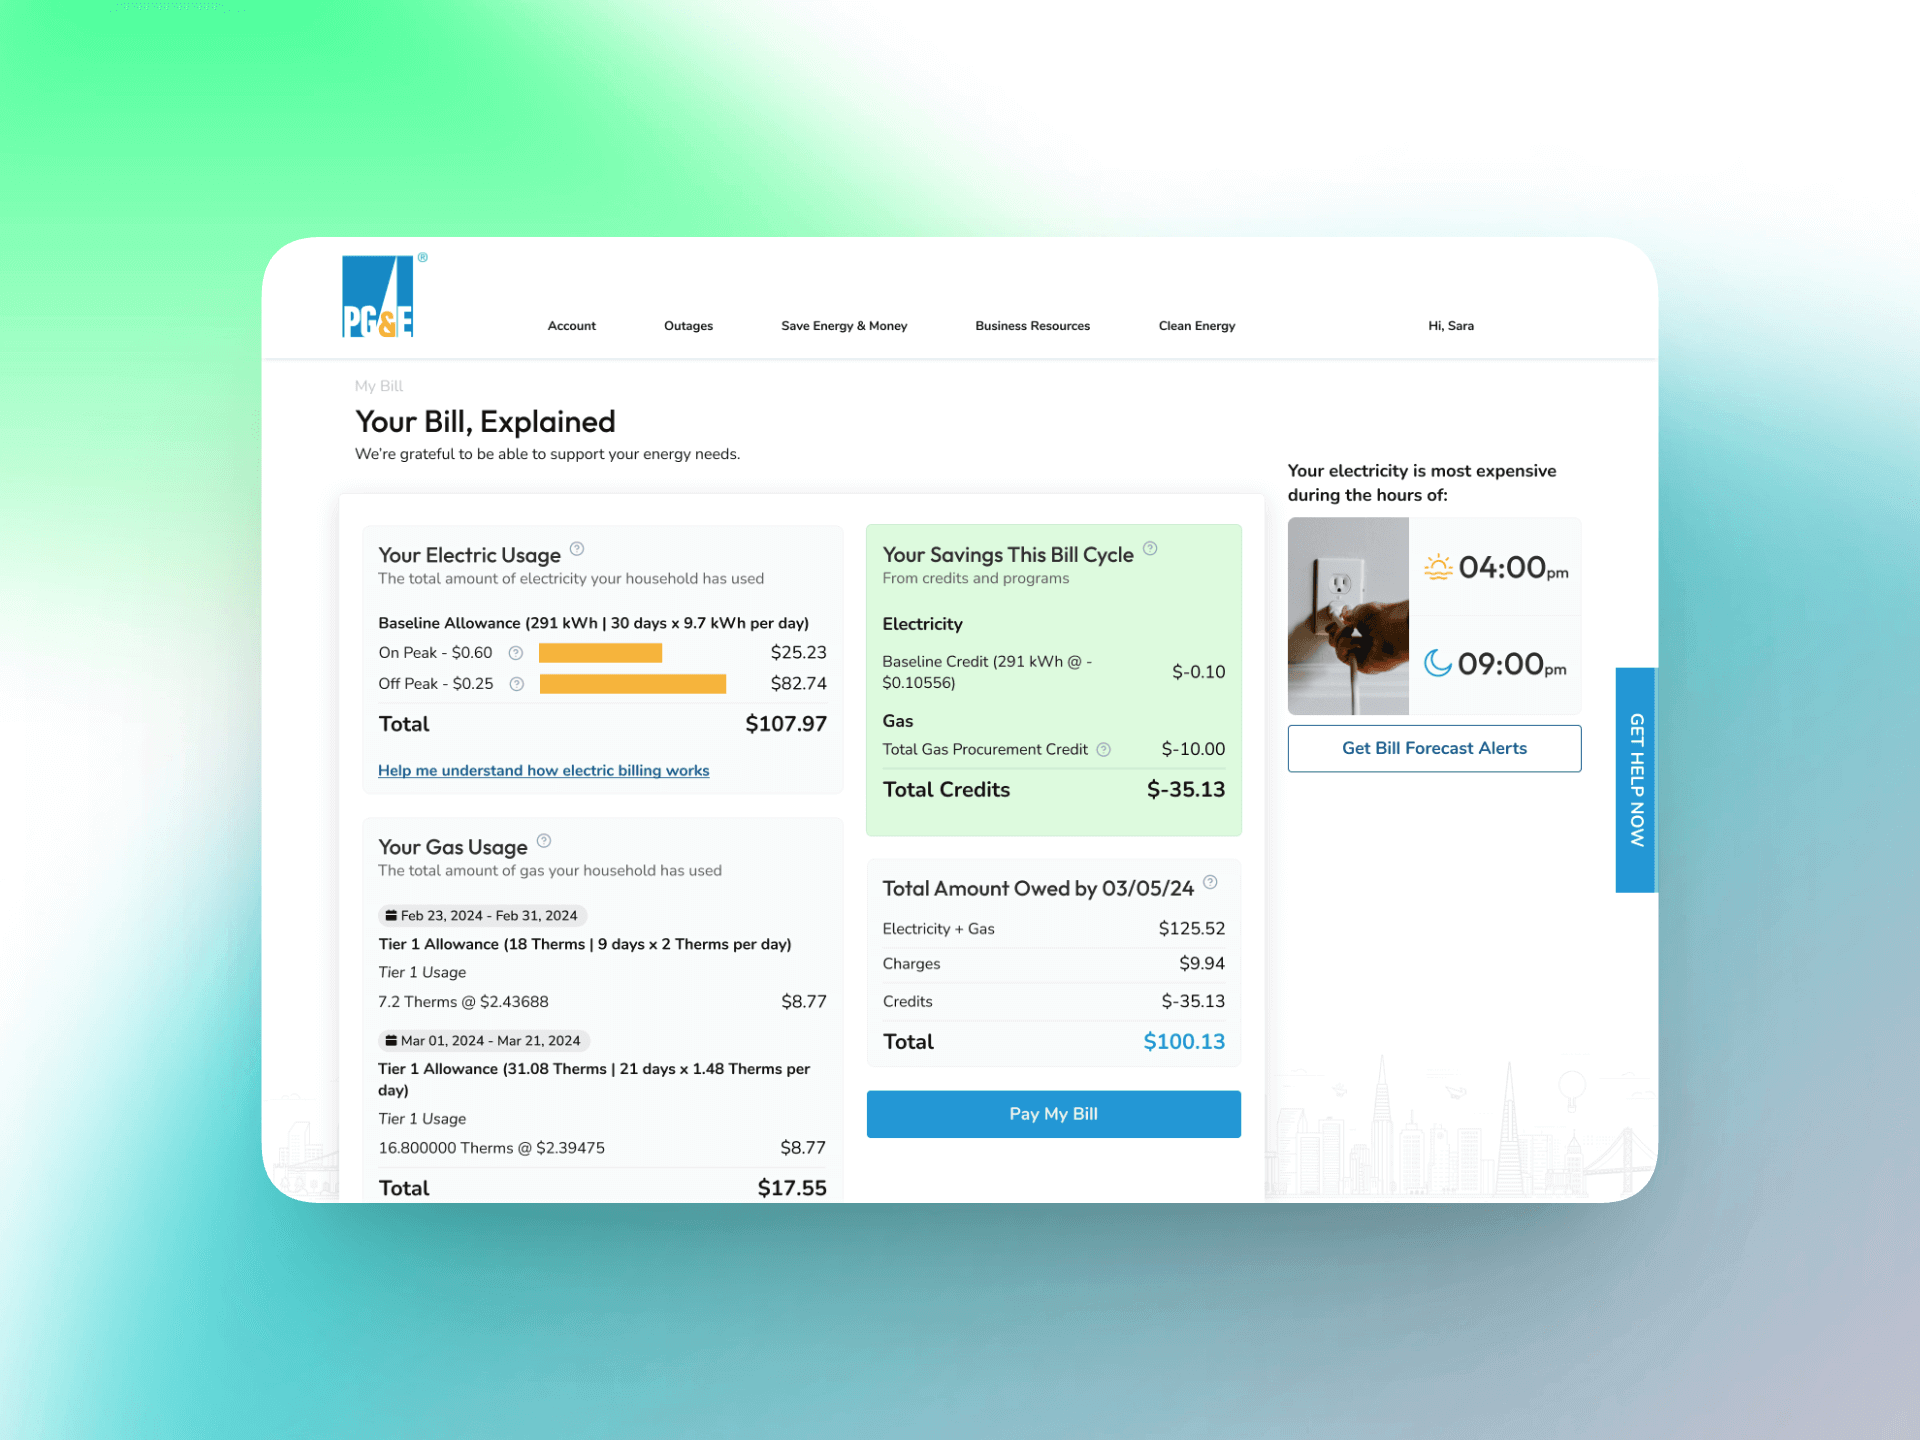
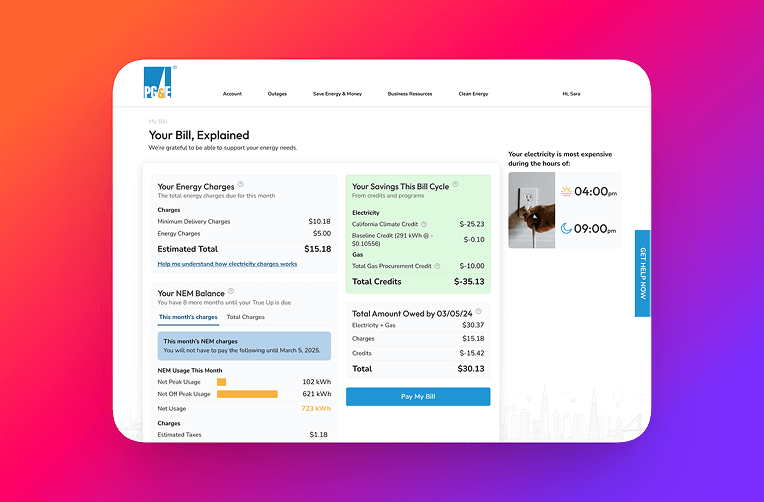
Bill Comparison & Forecasting
Helping customers stay ahead of their expenses with intelligent bill forecasting and historical comparisons to eliminate surprises.
Requirements covered:
Requirement 2.1
Platform provides a detailed breakdown of billing charges (total bill, Elec, gas) : costs attributed to TOU charges, fixed fees and cost of energy changes. This applies to all residential customers receiving a PG&E bill.
Requirement 2.2
Platform attributes bill variance to: weather, cost of energy use, billing period days, cost of energy changes, programs, taxes and fees, or any other change of consequence to customer. PG&E can help with creating a complete list. PG&E must sign off on final list.
Requirement 2.3
Platform provides detailed breakdown of billing charges attributed to donations (ex: REACH) (either customer donated to reach our customer received assistance from REACH).
Requirement 2.4
Platform allows solar customers to compare and evaluate their entire year's bill costs (including true up cost) compared to last year bill. Provide the same for monthly comparisons.
Requirement 2.5
Platform shall display a pop-up window or notification with- links to other PG&E tools or programs, suggest a better rate, upcoming weather events that may impact usage, provides advice such as shifting usage to save money, or ask for customer feedback on the user experience. Have the ability to store and surface to PG&E employees via searchable database. Must have the ability to add a net new pop up within the same day.
Requirement 3.1
Platform will allow customers to see their projected bill using current usage and projected usage information for the current bill period. Users can see the breakdown of the accrued and projected costs that make up the projected bill. Must be provided in dollars.
Requirement 3.2
Platform provides the ability for customer to set their PG&E Bill Forecast Alert from this tool. Goal is to make it easy for a customer to make a change or take action from the tool they are in vs having to leave tool and go to a separate location.
Requirement 4.1
Platform will allow the customer to download their bill total amount ($), electric and gas usage data in .xml or .csv formats in user specified time. Green Button Download downloads energy cost and usage data in an industry-standard XML format which is consistent across all energy-provider websites (i.e. in accordance with Green Button initiative)
Video Walkthrough
Overview
Walkthrough of the bill comparison features.
Snapshots
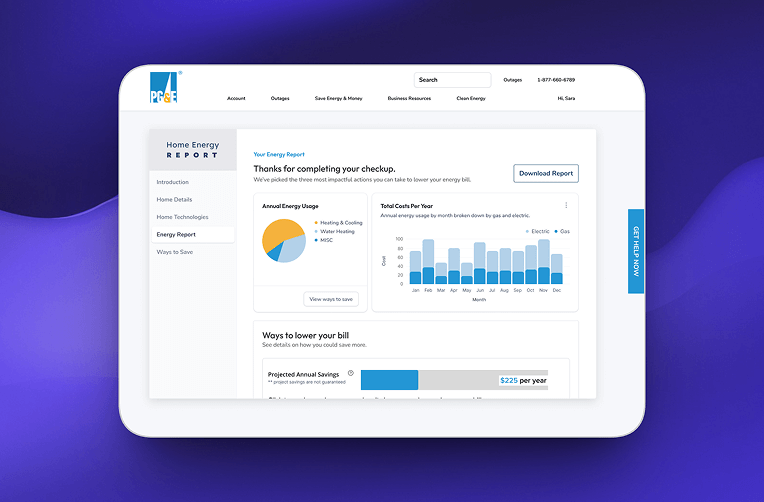
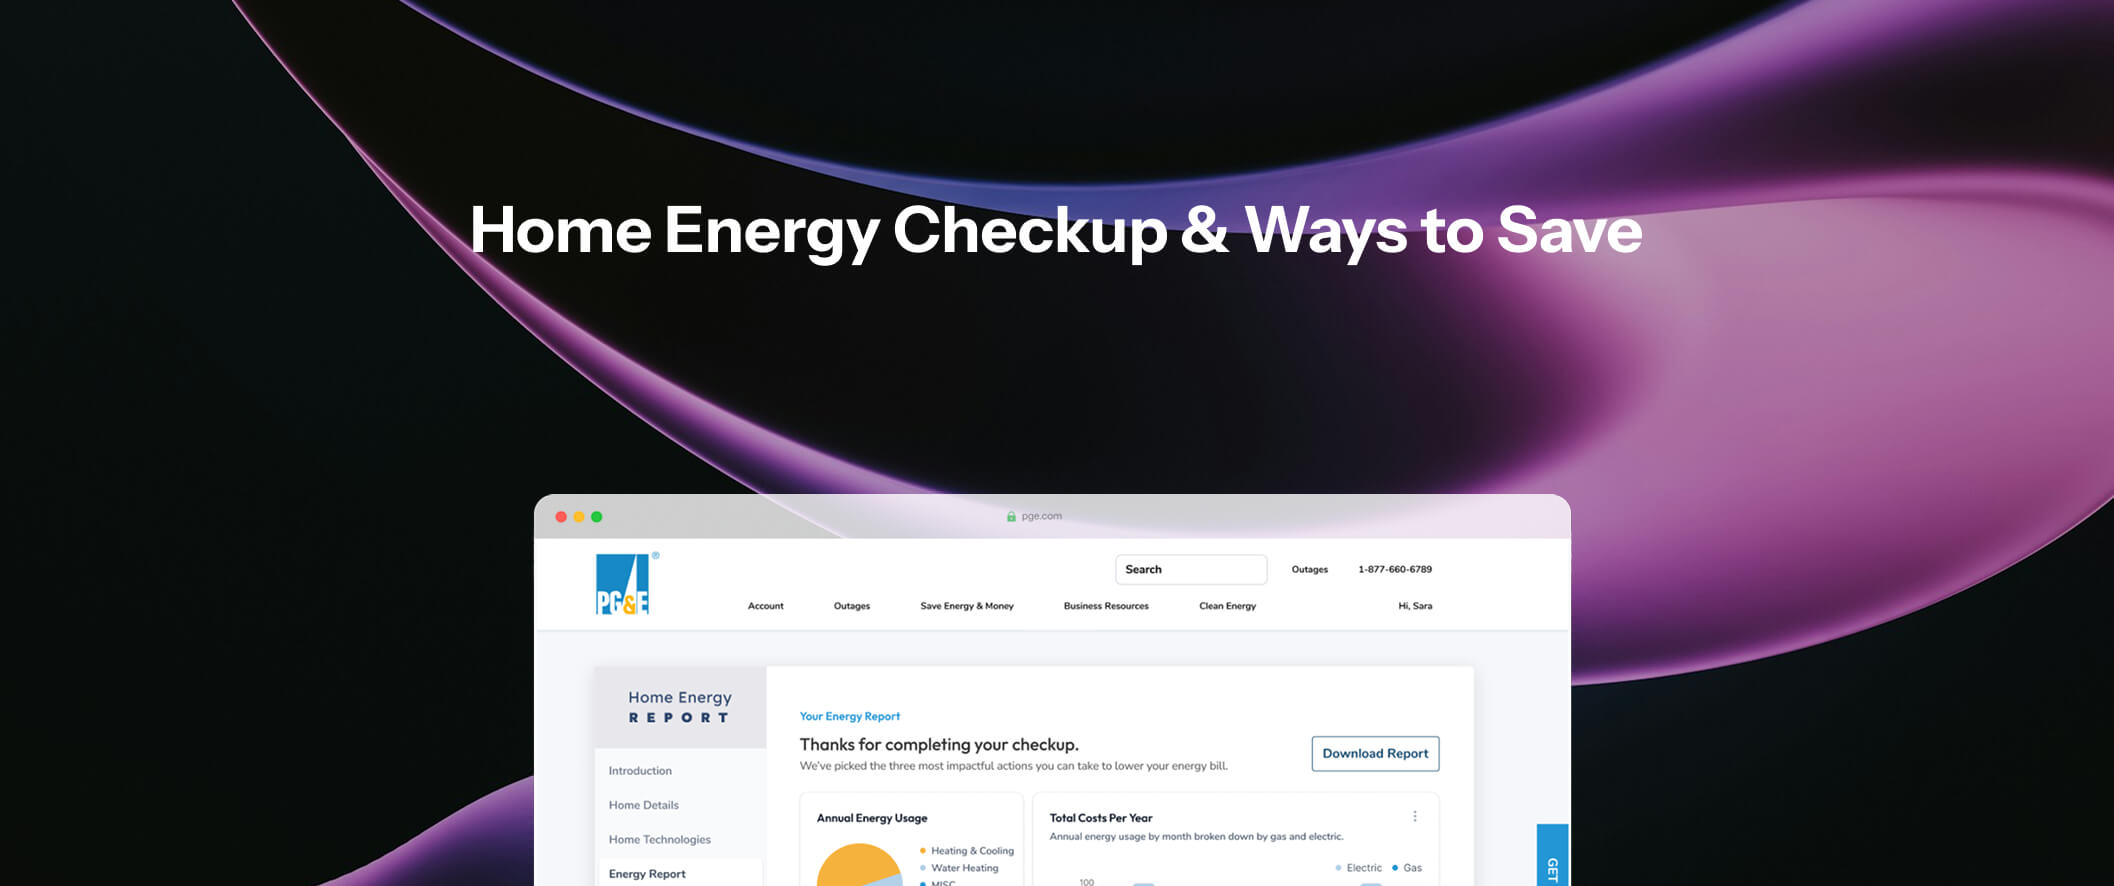
Home Energy Checkup & Savings
Helping customers perform a comprehensive digital audit of their home to identify inefficiencies, actionable improvements, and personalized recommendations of ways to save.
Requirements covered:
Requirement 5.1
Platform will ask customers questions about their home. The responses to these questions help tailor the energy conservation measures that are recommended to their interests, as well as helping to provide more personalized insights and analytics.
Requirement 5.2
Platform will provide an assessment report which pulls in the graphs from the cost and usage section of the platform (electric usage, gas usage, weather impact - electric, weather impact - gas and operating schedule). This report will also display disaggregated energy use and the top energy saving recommendations for the customer.
Requirement 5.3
Implementer provides monthly completion count taking into account the one-year effective useful life (EUL) logic that PG&E will have to share with the supplier. The goal here is to confirm audit completion per California public utilities commission requirements.
Requirement 5.4
When customer gets to their tips page, if the savings amounts could show based on their existing personalized billing information, not the average customer savings value.
Requirement 5.5
When customer gets to their tips page also direct them to any relevant PG&E programs, tools, advise, other changes or actions they can take.
Requirement 5.6
Store relevant information that customers enter about their home (e.g. appliances, DERs, interest in future equipment) to future analysis related to marketing of PG&E programs and incentives and impacts on grid forecasting (link to PG&E databases such as CAS and others).
Requirement 5.7
Include relevant information about which EV(s) and chargers they have installed. This will help us determine the load these will present and if there is an opportunity for V2X participation.
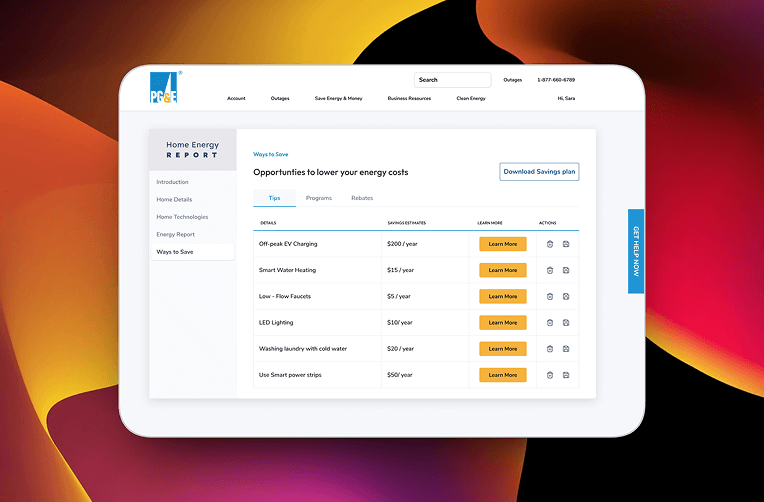
Requirement 6.1
Platform presents customers with a list of programs and energy savings recommendations that have been tailored to them based on the energy usage and HER information (heating/cooling type, rent/own, annual usage and energy intensity, etc.) and segment (e.g. solar / EV / storage). Platform should exclude programs that customers are already on / and be able to display them to customers.
Requirement 6.2
Platform will show Energy savings potential for each measure is estimated based on the customer’s historical energy use patterns.
Requirement 6.3
Platform will allow recommendations to be filtered by category or sorted. Categories dynamically update depending on type. They can also be sorted by Relevance, Potential Savings, Payback Period and Recommended to You, and carbon savings.
Requirement 6.4
Recommendations will have actionable next steps. i.e. button to start enrollment / program page.
Requirement 6.5
Platform will track when end user interacts with Recommendations.
Requirement 6.6
Platform will capture recommendations Interaction data & data must be accessible by utility staff for the purpose of program outreach and follow up.
Requirement 6.7
Platform will allow customer to create a savings plan.
Requirement 6.8
Platform will allow customer to track recommendations/savings plans actions - decline, completed, or in progress.
Requirement 6.9
Platform will allow customer to filter their "ways to save" by category.
Requirement 6.10
Platform recommendations will provide (or link to) PG&E programs that the customer is eligible for. All PG&E programs should be included (ex. Load Management Programs, PG&E can provide a complete list).
Requirement 6.11
Platform will integrate with utility program participation data, in order to show the end-user how many programs similar customers have joined. This includes load management data.
Video Walkthrough
Overview
Walkthrough of the home energy checkup features
Snapshots